DASHBOARDS
Steer your business in real time
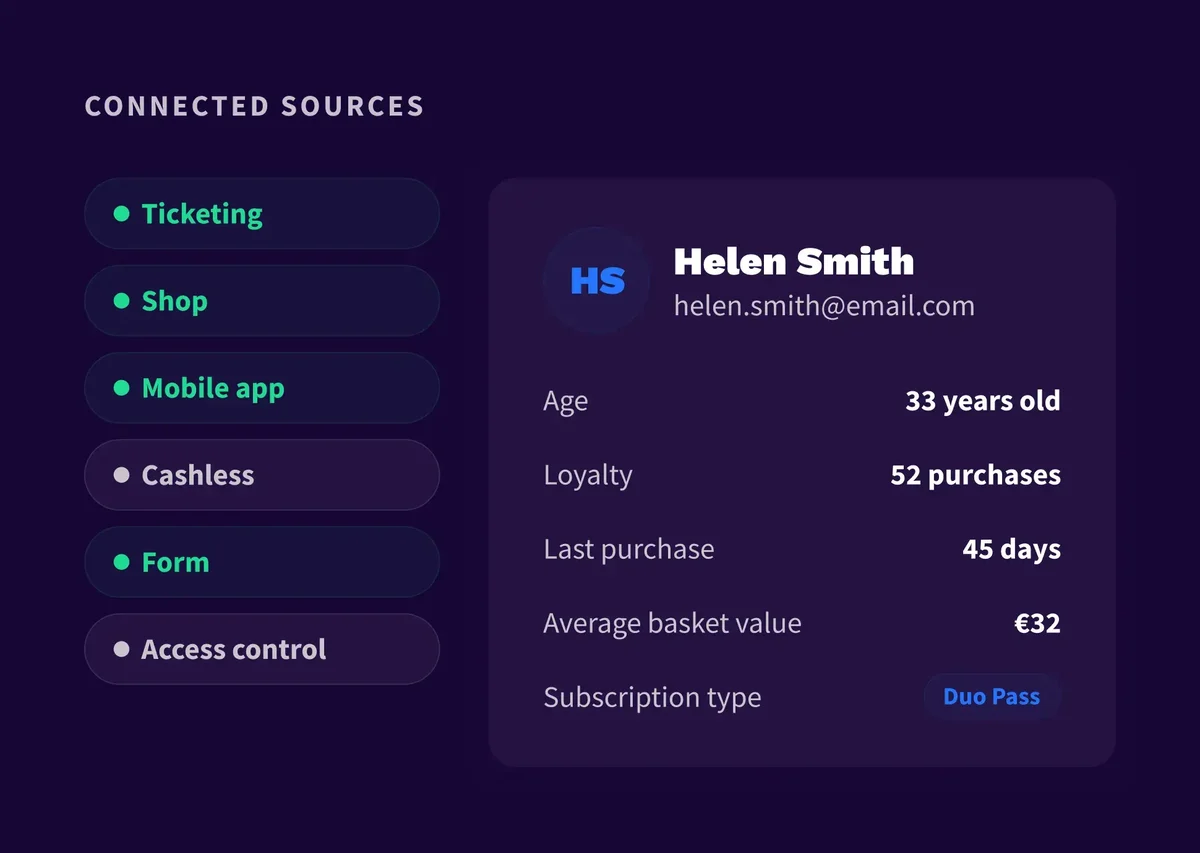
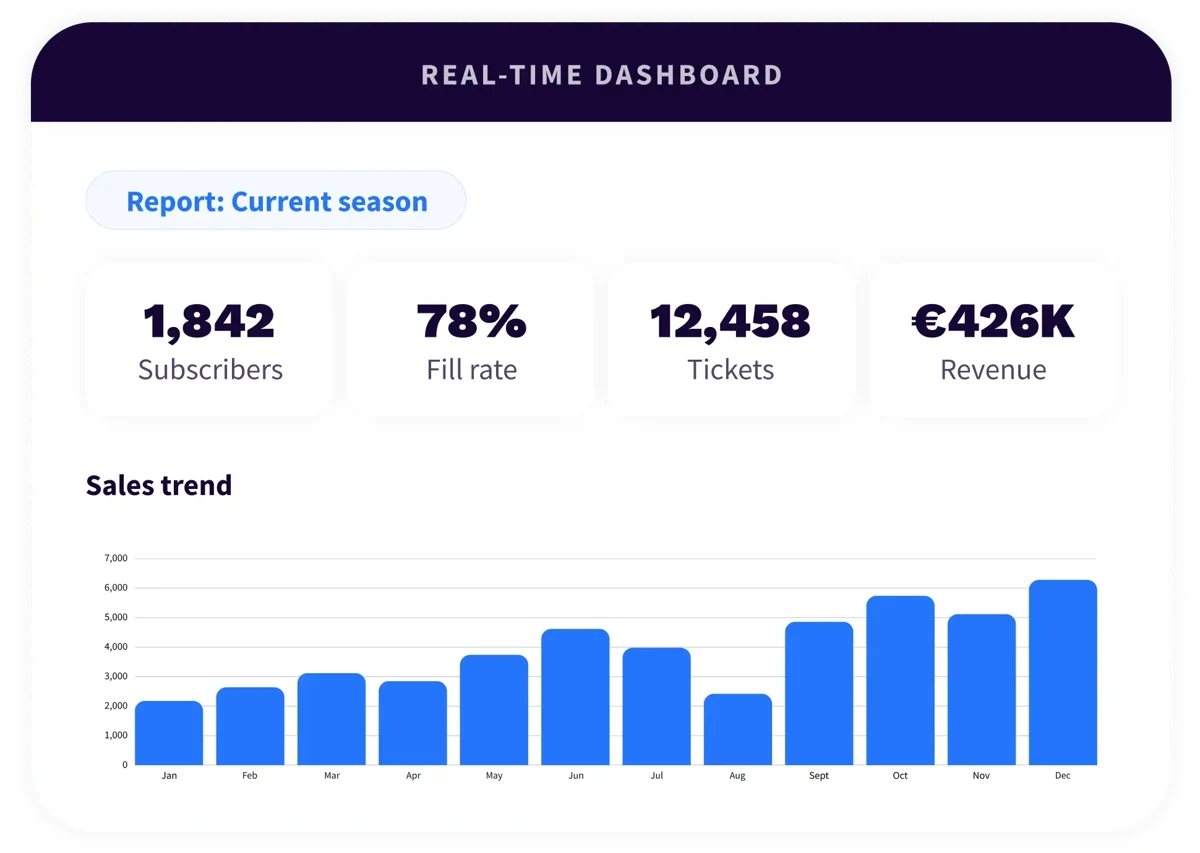
Dashboards ready from day one: sales, attendance, memberships, programming.
- Ready-to-use business reports as soon as your ticketing is connected
- Sector indicators tailored to your challenges: occupancy, season tickets
- Continuously updated data to track your activity without manual exports
The outcome: The metrics that matter, without building a single report.
ANALYSIS
Spot growth opportunities
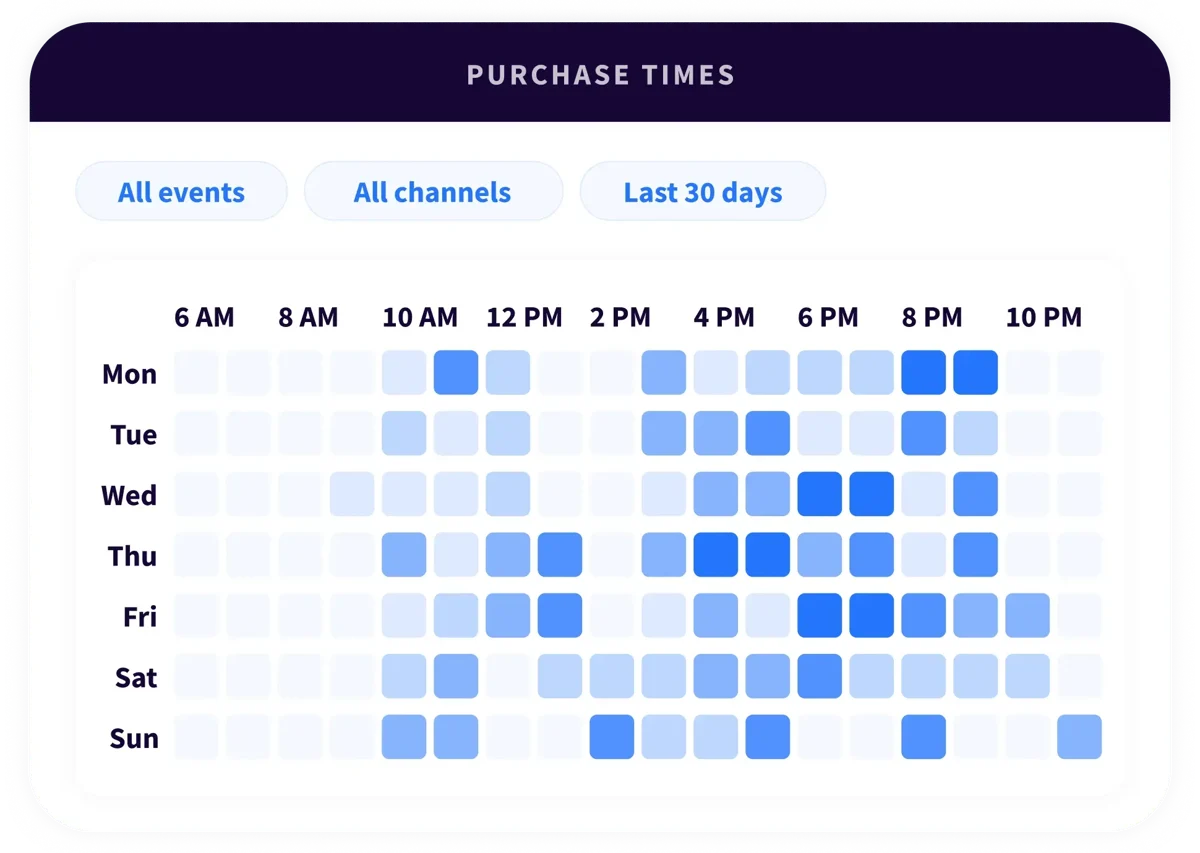
Analyse your sales by channel, period, category or event and visualise buying moments with heatmaps.
- Sales heatmaps by day and hour to identify peak times
- Multi-criteria analysis by event, channel, product or price category
- Performance comparison to identify growth levers
The outcome: You know where to focus your sales and marketing efforts.
UNDERSTANDING
Understand audience behaviour
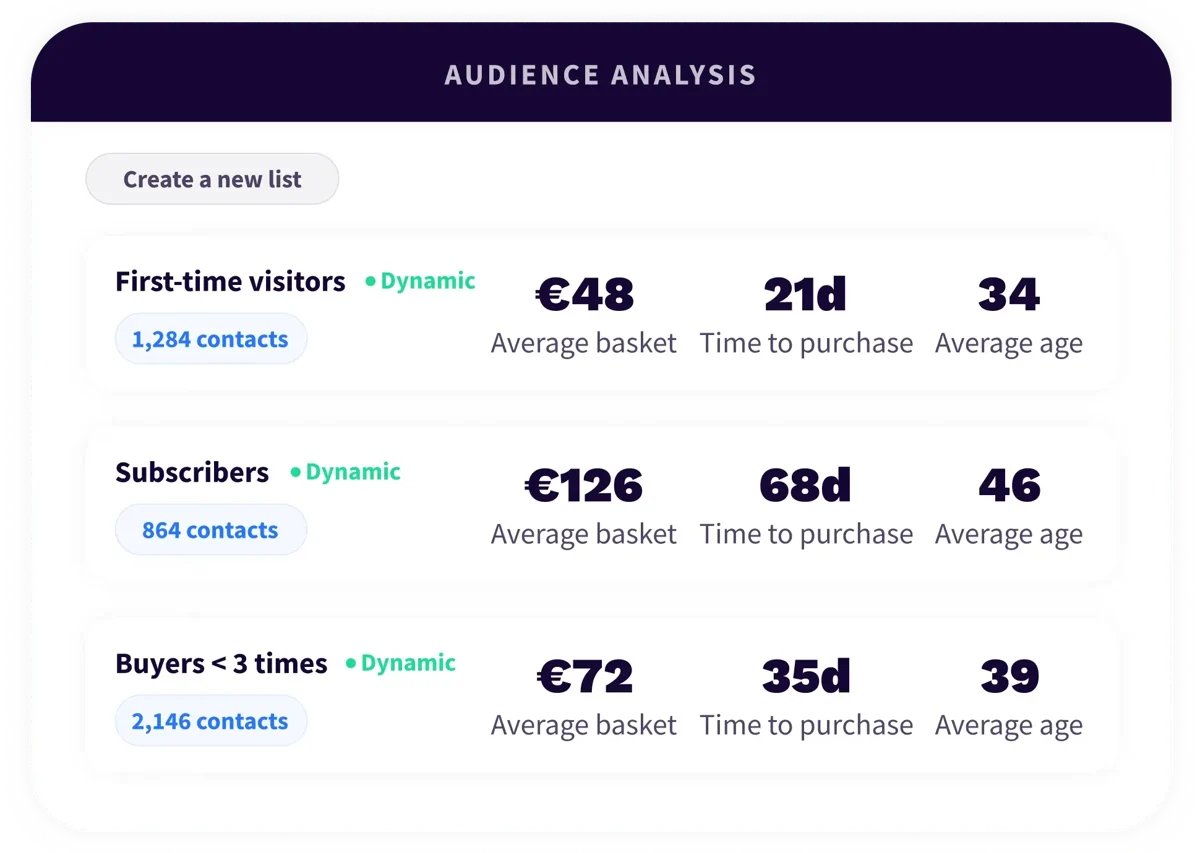
Compare first-time visitors, season ticket holders, regulars and occasional visitors, and analyse sales by segment and seating category.
- Segmentation by loyalty, visit frequency or buying habits
- Cross-referencing of attendance, ticketing and consumption data
- Audience value analysis to identify the most engaged segments
The outcome: Programming, offers and campaigns adapted to every profile.
ROI MEASUREMENT
Measure your marketing impact
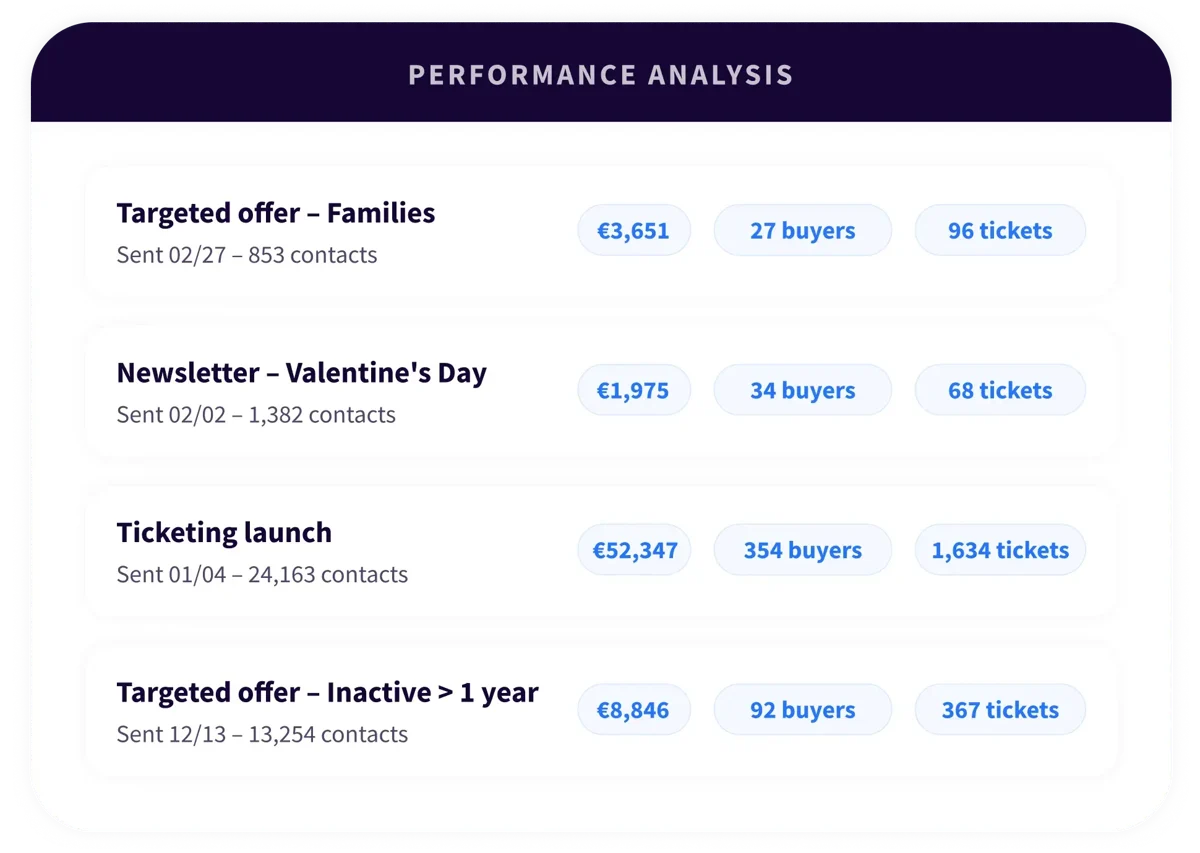
Cross-reference campaigns and sales data to see what truly drives results.
- Revenue attributed to each marketing campaign
- Comparison of acquisition and loyalty channels
- ROI dashboards to track the effectiveness of your actions over time
The outcome: You invest in what performs, and you can prove it.
Platform
Go further with our other modules.
Connect
The CDP foundation that centralises and cleans every data source upstream, in real time.
Marketing
Turn dashboard insights into high-performing marketing segments in a few clicks.
Sales & Fundraising
Apply the same segmentation power to corporate targets: partners, sponsors, group buyers.
SSO
Give your audiences one account and one login across all your platforms to streamline the buying journey.